GReaT: Generating Realistic Tabular Data
Most teams working with data run into the same problem sooner or later: you need data you do not have.
Maybe you have a real dataset, but it is too small. Maybe it contains rare edge cases you cannot reproduce. Maybe it is locked behind compliance approvals that take weeks. Or maybe you simply cannot share it outside your organization.
Synthetic data offers a way out. The idea is straightforward: generate artificial data that behaves like the real thing. Not random noise, and not exact copies. Instead, you create a dataset that:
- matches the statistical distributions you care about
- preserves relationships between columns
- does not leak actual records from production
- can be generated in any quantity you need
This lets teams prototype before approvals arrive, run experiments without touching sensitive information, stress-test models on rare scenarios, and share realistic data with partners or students.
The core insight is simple: separate the usefulness of data from its sensitivity.
What is GReaT?
GReaT stands for Generation of Realistic Tabular data. It is an open-source Python library that uses large language models (LLMs) to generate synthetic versions of your tables.
The approach is based on research published at ICLR 2023 (one of the top machine learning conferences). Today, GReaT has over 140,000 downloads, ranks in the top 10% of all packages on PyPI, and has been adopted in practice on Google’s Kaggle platform for synthetic data generation across multiple competitions. You can see the download statistics at clickpy.clickhouse.com/dashboard/be-great and browse the source code at github.com/tabularis-ai/be_great.
In practical terms, GReaT gives you three things:
- Structure preserved: The model learns distributions and correlations between columns automatically
- Raw data stays put: You move model checkpoints around, not customer rows
- Unlimited extra data: Generate as much as you need for experiments, demos, QA, or stress tests
Quick Start
Here is the simplest way to try GReaT:
from be_great import GReaT
from sklearn.datasets import fetch_california_housing

data = fetch_california_housing(as_frame=True).frame

model = GReaT(llm='tabularisai/Qwen3-0.3B-distil', batch_size=32, epochs=5,
              fp16=True, dataloader_num_workers=4)
model.fit(data)

synthetic_data = model.sample(n_samples=100)
This trains a model on the California Housing dataset and generates 100 new synthetic rows. You can then compare distributions, train downstream models, or use the synthetic data however you need.
If this quick test works for your use case, you have a new tool in your workflow. If it does not, you have lost about five minutes.
How It Works
Most synthetic data tools feel abstract. GReaT is fairly concrete.
The core idea comes from an observation: language models are very good at predicting “what comes next” given some context. If you frame each row of your table as a sentence, you can use a language model to learn the patterns and then generate new sentences (rows).
Here is the training pipeline:
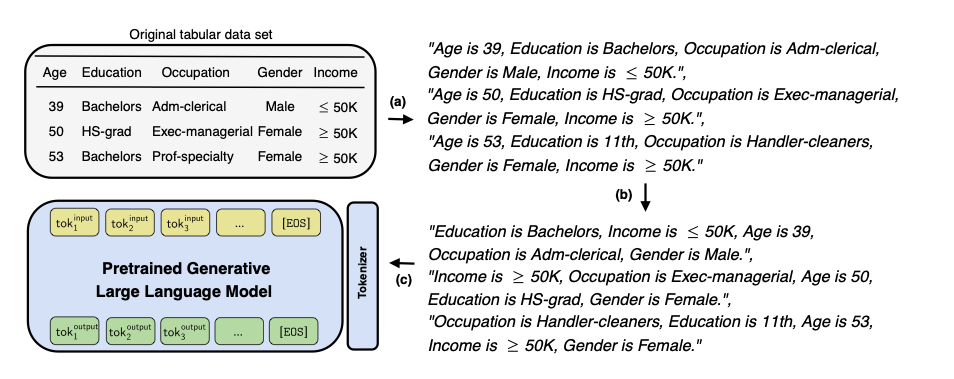
First, a textual encoding step transforms tabular data into meaningful text. Then a feature order permutation step is applied — this is important because it prevents the model from learning a fixed column order and instead forces it to understand the relationships between features regardless of their position. Finally, the obtained sentences fine-tune a pretrained language model.
At sampling time, the process runs in reverse:
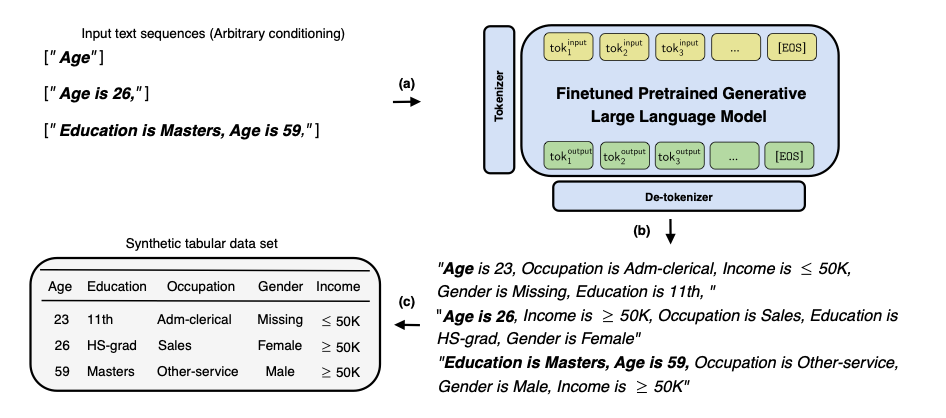
You provide either a single feature name or an arbitrary combination of feature-value pairs as text input. The fine-tuned LLM completes the sequence, and the output is transformed back into a tabular row. Because the model learned permuted feature orders during training, it can generate conditioned on any subset of features without retraining.
This is the whole approach. No separate encoders for different data types, no complex preprocessing pipelines.
Does It Actually Work?
Here is a visual sanity check from the paper. The California Housing dataset contains geographic data (Latitude and Longitude) that creates the recognizable shape of California when plotted. This is a hard test for any generative model — it has to learn a complex, non-trivial joint distribution.
Comparison of joint distributions of Latitude and Longitude (from the paper): original data, several baselines, Distill-GReaT, and full GReaT.
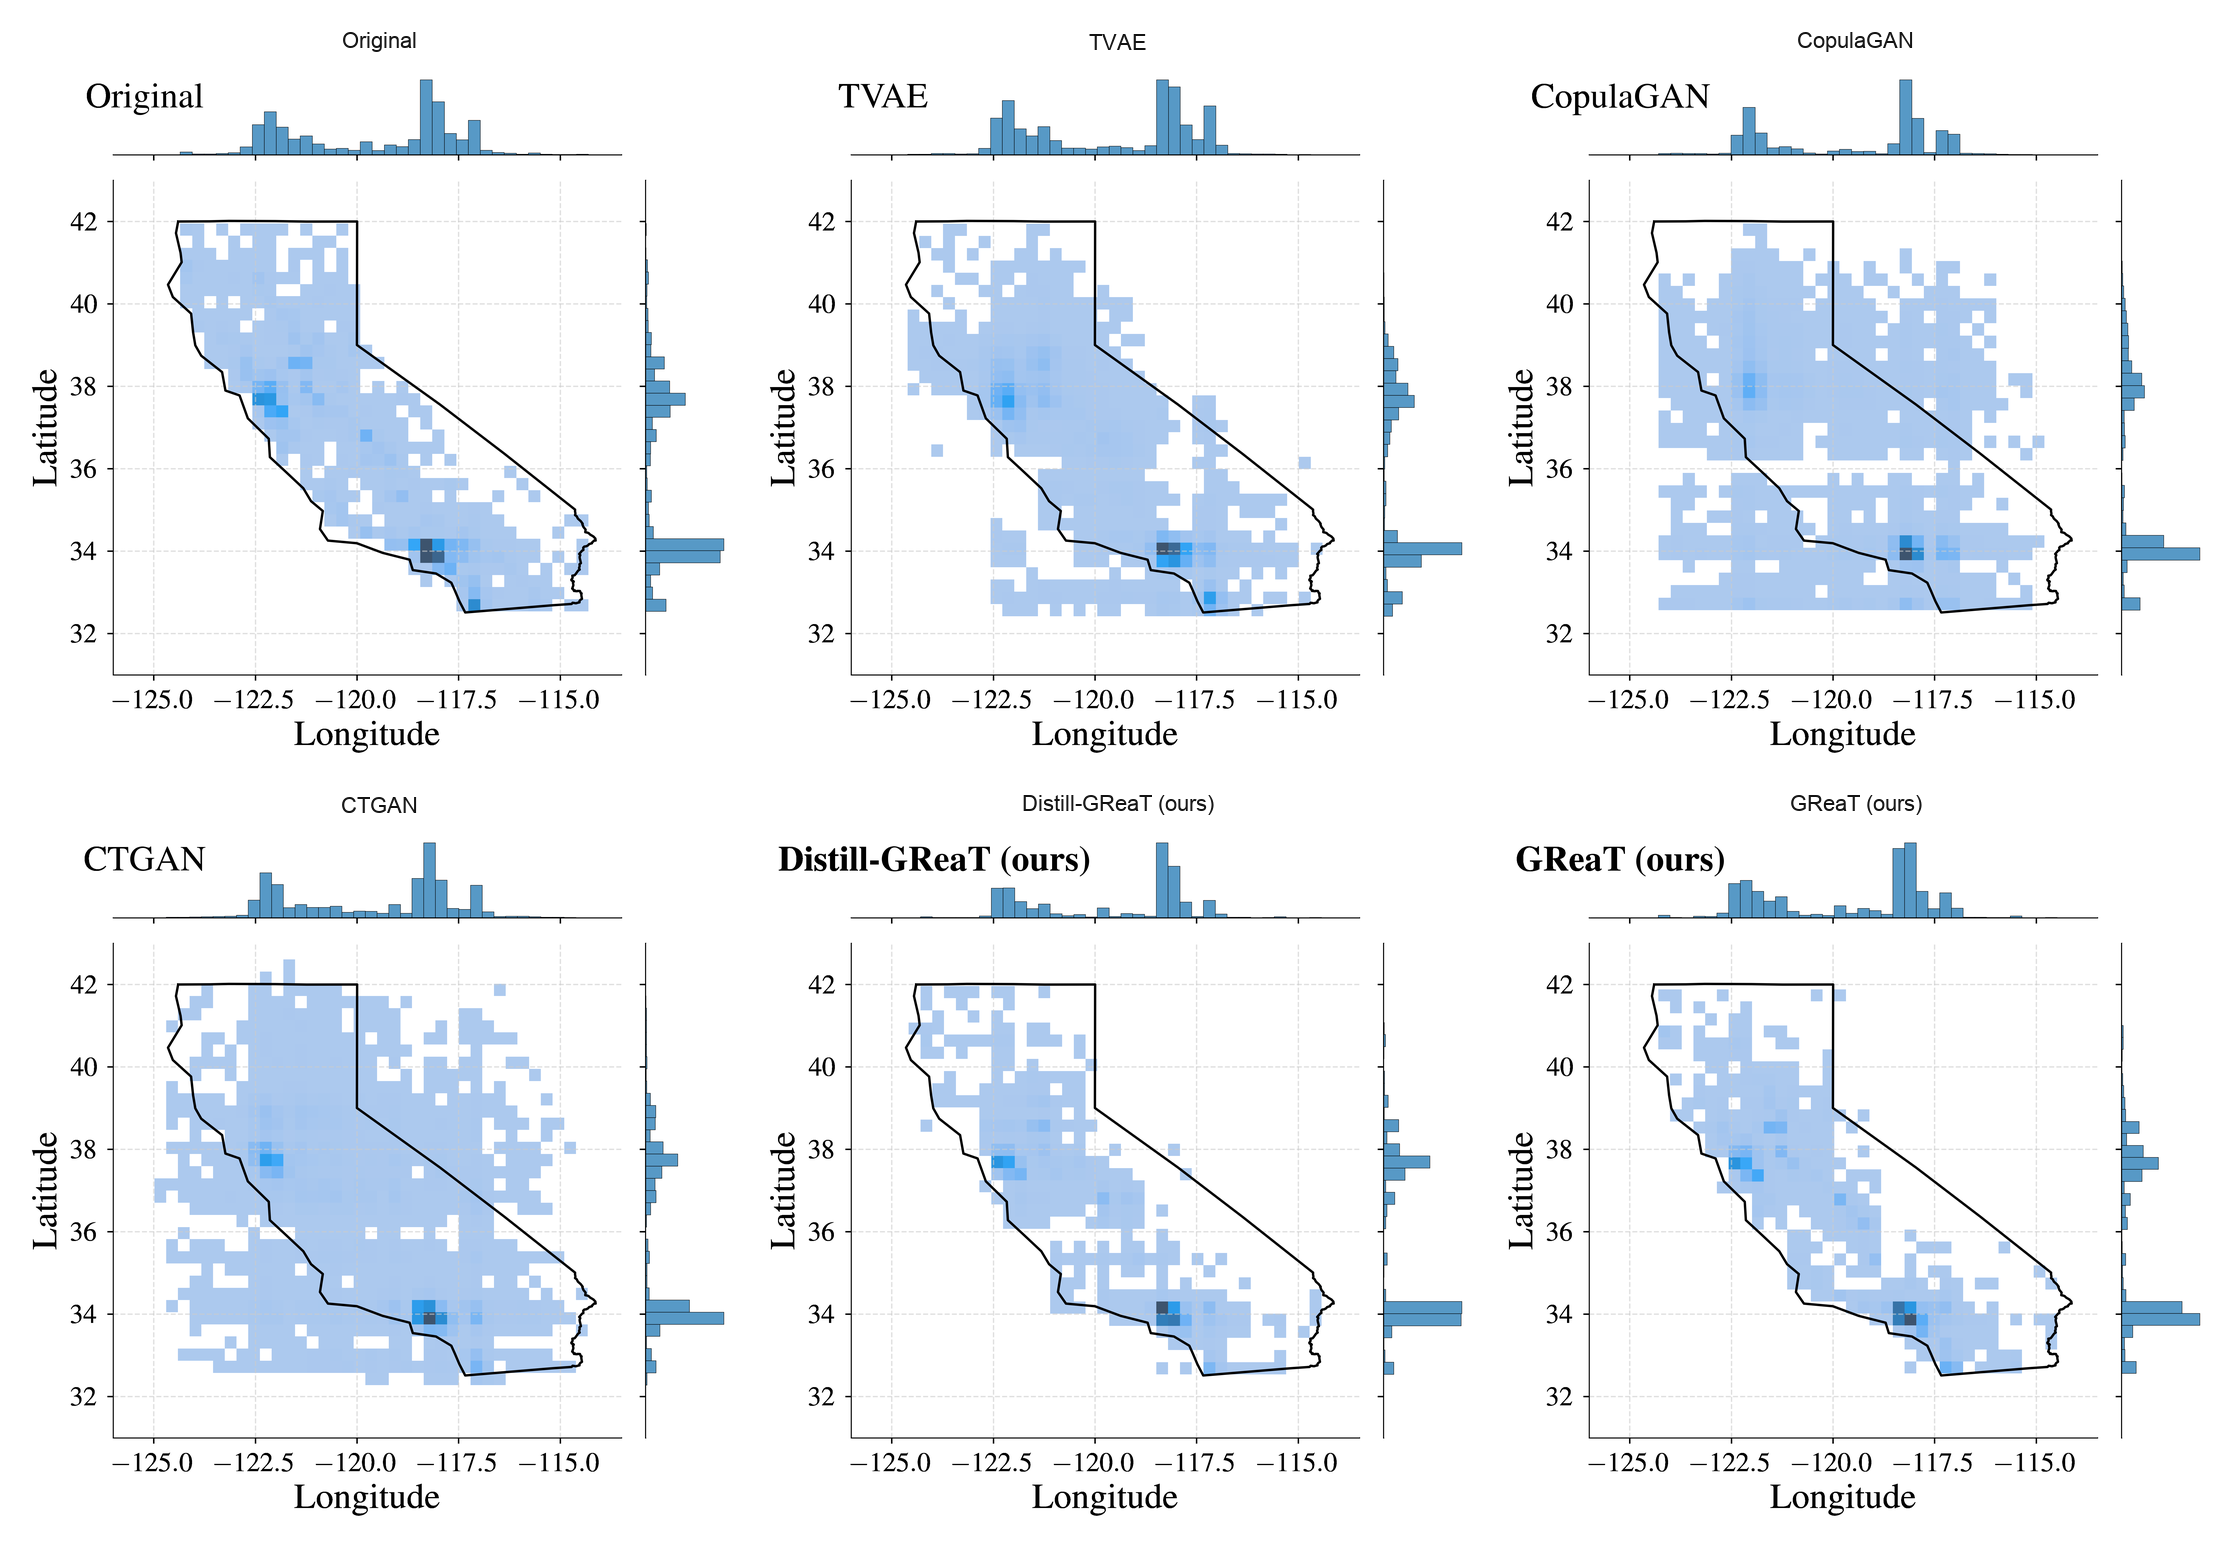
The shape is preserved. The model learned the geographic structure of California from nothing but tabular rows converted to text. Traditional approaches like CTGAN and TVAE struggle significantly more with this kind of complex spatial relationship.
Where Teams Use GReaT
Three patterns come up repeatedly:
Sharing data without sharing data
You cannot send production data to an external vendor, a student intern, or a partner company. Instead, you train GReaT on the real table and share only the synthetic version. This is not a privacy guarantee by itself, but it is a significant improvement over emailing CSVs.
Prototyping before access is approved
Many teams use GReaT to create “shadow datasets”. They build their entire pipeline on synthetic data, get everything working, and then swap in the real table once compliance approves access. This can save weeks of waiting.
Stress-testing on rare cases
If you need to see how a model behaves on specific segments (high-income customers, rare product categories, edge-case combinations), you can generate more data for exactly those slices.
Conditional Generation
Sometimes you do not want random synthetic rows. You want synthetic rows that match specific criteria.
GReaT supports constrained sampling with logical operators — every output row is valid with zero waste:
synthetic_data = model.sample(
    n_samples=100,
    conditions={
        "age": ">= 40",
        "hours-per-week": "<= 40",
        "sex": "!= 'Male'",
    },
)
Supported operators for numeric columns: >=, <=, >, <, ==, !=. For categorical columns: ==, !=. Multiple conditions can be combined in a single call.
Here is what conditional generation looks like in practice on the Adult Income dataset. By changing the input conditions, the model produces different conditional distributions:
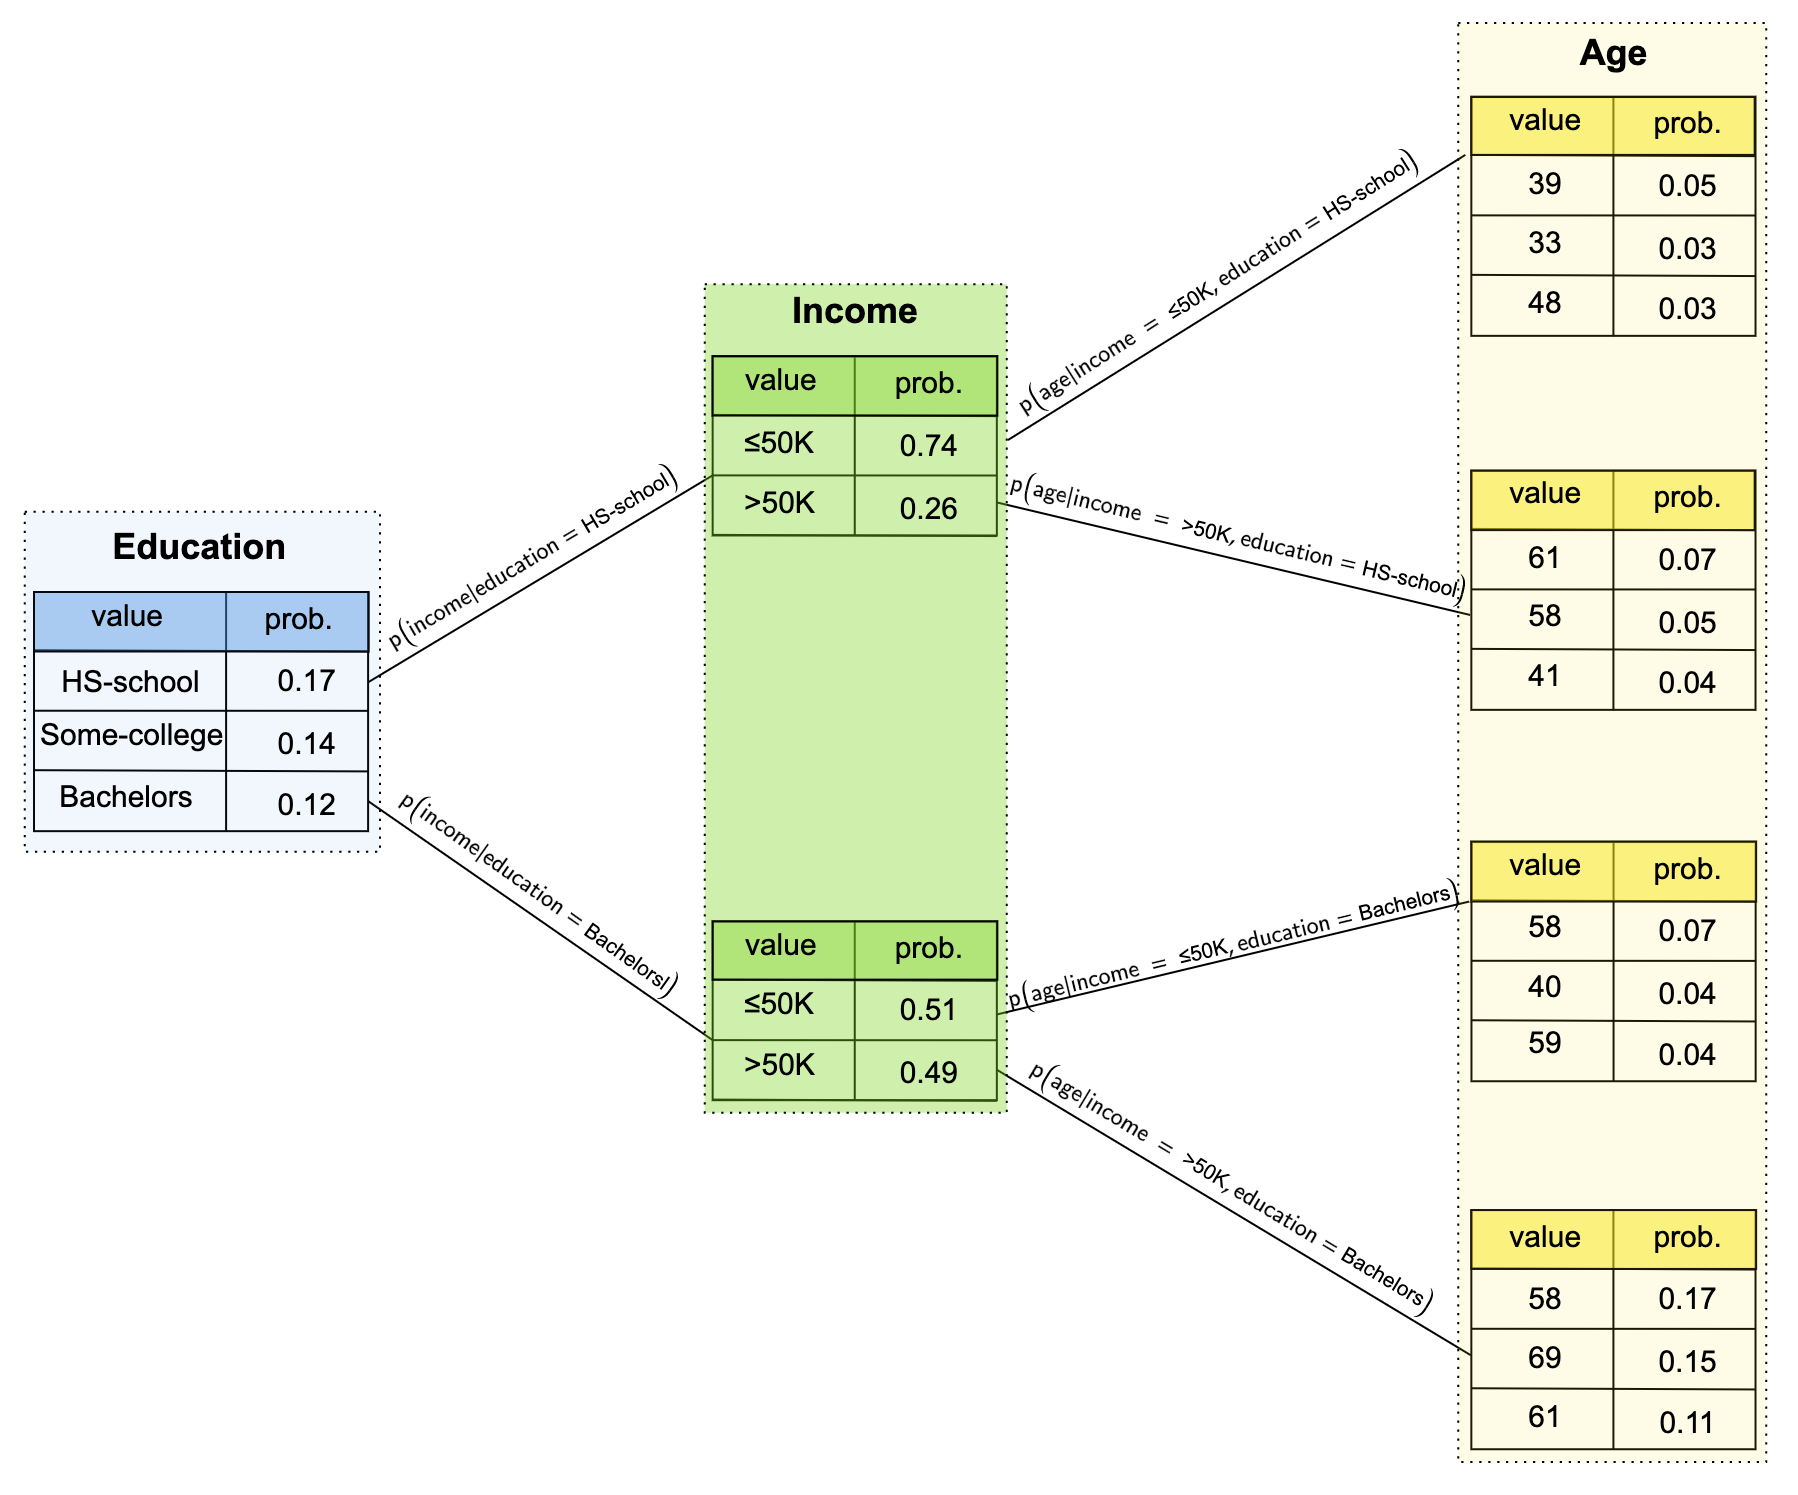
The model successfully learns that Income has only two categories and produces the correct conditional distributions for Age depending on the combination of Education and Income constraints.
Filling Missing Values
A lesser-known feature: once you have trained a GReaT model, you can use it to impute missing values in your data.
imputed_data = model.impute(incomplete_data, max_length=200)The model uses what it learned about the joint distribution to make educated guesses about missing entries. No hand-crafted rules required.
Efficient Fine-Tuning with LoRA
For larger models or limited hardware, GReaT supports LoRA (Low-Rank Adaptation) for parameter-efficient fine-tuning. This drastically reduces memory usage and training time:
model = GReaT(
    llm='meta-llama/Llama-3.1-8B-Instruct',
    batch_size=32,
    epochs=5,
    efficient_finetuning="lora",
    fp16=True,
)
model.fit(data)
synthetic_data = model.sample(n_samples=100)
This means you can fine-tune models with billions of parameters on consumer hardware — something that would otherwise require expensive GPU clusters.
Built-in Quality Metrics
GReaT ships with a built-in evaluation suite to measure the quality, utility, and privacy of your synthetic data:
from be_great.metrics import ColumnShapes, DiscriminatorMetric, MLEfficiency

ColumnShapes().compute(real_data, synthetic_data)
DiscriminatorMetric().compute(real_data, synthetic_data)
MLEfficiency(model=RandomForestClassifier, metric=accuracy_score,
             model_params={"n_estimators": 100}).compute(
    real_data, synthetic_data, label_col="target"
)
The suite covers statistical similarity (distribution matching, correlation preservation), fidelity (can a classifier tell real from fake?), downstream utility (does a model trained on synthetic data perform well on real test data?), and privacy (distance to closest record, k-anonymization, membership inference).
Why Use a Language Model?
We tried the usual approaches first: GANs (like CTGAN), variational autoencoders (TVAE), and classical statistical methods like copulas.
These can work well, but they tend to need more manual tuning, struggle with mixed data types and free-text columns, and are harder to condition in flexible ways.
Language models solve a different problem: “given this context, what comes next?” Once you frame table rows as sequences, you can use that capability directly. The model handles mixed types naturally because everything becomes text.
The research paper goes into more detail: arXiv:2210.06280.
Real-World Applications
We see GReaT used across industries:
- Healthcare: Generating synthetic patient records for method development and testing
- Finance: Creating realistic transaction data for fraud detection prototypes
- Manufacturing: Producing sensor data for anomaly detection experiments
- Research: Augmenting small datasets when you only have a few thousand rows
- Kaggle competitions: Adopted on Google’s Kaggle platform for synthetic data generation
Getting Started
Install the package:
pip install be-greatThen try it on your own data. The GitHub repository has documentation and examples, including a Google Colab notebook you can run immediately.
If you need help with a specific use case or want a custom solution for your organization, reach out to us at [email protected].
Community
GReaT is an active open-source project. If you try it on a dataset where it fails, that feedback is just as valuable as a success story. You can open issues, submit pull requests, or join our Discord:
Citation
If you use GReaT in academic work, please cite the original paper:
@inproceedings{borisov2023language,
  title={Language Models are Realistic Tabular Data Generators},
  author={Vadim Borisov and Kathrin Sessler and Tobias Leemann and Martin Pawelczyk and Gjergji Kasneci},
  booktitle={The Eleventh International Conference on Learning Representations},
  year={2023},
  url={https://openreview.net/forum?id=cEygmQNOeI}
}
GReaT is developed by Tabularis AI. We build AI solutions for synthetic data generation, privacy-preserving analytics, and enterprise data protection.